Urban research / Wittenberg place lab
Consider housing, journeys and costs together.
Compare access to facilities in Wittenberg and calculate your own housing and travel costs.
01 · Your everyday life / location
Which location fits your everyday life?
First compare what you can reach on foot. Then examine a specific home and your total housing and travel costs. The map and this view use the same starting points.
Loading the shared location data.
| Your surroundings | 5 min | 10 min | 15 min |
|---|
A starting point is a mapped facility, not a home address or a district average. Available homes, their actual rent, condition, entrances and the full journey to work need a separate check. City rent benchmarks do not give the price of a home at this location.
Mapped selection: baseline 6 October 2026, cultural supplement retrieved 19 October 2026. Street network: 6 May 2026. Model: shortest paths at 4.8 km/h, including straight attachments. No measured popularity or overall ranking of residential quality. © OpenStreetMap contributors, ODbL. Hotspot data and method (JSON).
02 · Your everyday life / costs
More space. What does it cost?
Compare the rent you actually pay under your current lease with a specific new offer in Wittenberg. Enter each home’s own floor area. Then include household costs or examine the operation of a building.
Personal comparison: use your current lease and the new offer. A portal benchmark can be selected for an illustrative calculation.
Enter both rents to calculate your comparison.
Portal benchmarks in the city comparison.
Monthly household gain = previous area × previous rent − Wittenberg area × Wittenberg rent + net income change − travel cost change − other cost change − moving costs ÷ months.
Building minimum rent = (investment × annual capital requirement ÷ 1,200 + retained monthly costs) ÷ (1 − lost rent ÷ 100).
MGA comparison model. Your desired budget gain is a chosen target. Time is shown separately. A refundable deposit is a separate liquidity need. Inputs are calculated in this browser and are not submitted or saved.
03 · Results and evidence
Seven cities. Explicit comparisons.
Regional comparison
Lower rent can create financial room; proximity can support regional relationships. Choose one measure at a time. This is not an overall ranking of city quality.
| Rank | City / source | Portal benchmark | km |
|---|---|---|---|
| 1 | Wittenberg Rent source | 6.96 | 0 |
| 2 | Dessau-Roßlau Rent source | 7.00 | 28 |
| 3 | Magdeburg Rent source | 7.44 | 75 |
| 4 | Halle (Saale) Rent source | 7.72 | 63 |
| 5 | Leipzig Rent source | 9.09 | 62 |
| 6 | Berlin Rent source | 12.72 | 89 |
| 7 | Potsdam Rent source | 12.74 | 66 |
Lower rent benchmark: seven municipal values from the same portal series, Q2 2026.
ImmoScout24, Q2 2026, reviewed 10 October 2026. Reported average net cold apartment rents as market orientation. City names link to the respective source. These are not official rent indices or specific rental offers. Location, floor area and condition can differ substantially.
Existing-contract rents are paid under current leases. Asking rents are advertised prices for a new tenancy, including re-letting an older home. City comparisons require the same rent measure, period and geographical level. Asking rents: BBSR definition.
For a move, compare actual door-to-door journeys, costs, working hours and available offers. Transport context in the city figures
Housing / latest annual stock · 31 December 2025
How many homes are there relative to the population?
The latest complete annual figures compare the housing stock and official population of all seven municipalities. They describe the scale of existing housing, including vacant homes.
W = 1,000 × B / N homes per 1,000 residents
B counts homes in residential and nonresidential buildings, including hostels. N is the official population at the same year end. This calculation uses published stock figures. A high ratio can also result from vacancy or a shrinking population. Home size, condition and availability need a separate assessment.
Scroll the table sideways to see every measure.
| Rank | City | Housing stockhomes / 1,000 residents | Homesnumber | Population31.12.2025 |
|---|---|---|---|---|
| 1 | Dessau-Roßlau | 665.7 | 49,952 | 75,035 |
| 2 | Halle (Saale) | 638.9 | 144,505 | 226,186 |
| 3 | Magdeburg | 608.6 | 148,798 | 244,494 |
| 4 | Wittenberg | 601.6 | 27,033 | 44,937 |
| 5 | Leipzig | 586.0 | 360,917 | 615,932 |
| 6 | Potsdam | 562.1 | 104,058 | 185,137 |
| 7 | Berlin | 559.2 | 2,069,432 | 3,700,577 |
Sources: Saxony-Anhalt: housing stock (GENESIS 31231-0001) · Saxony-Anhalt: population (GENESIS 12411-0001) · Berlin / Brandenburg: housing stock 2025 (F I 1) · Berlin / Brandenburg: population 2025 (A I 3) · Leipzig: housing stock · Leipzig: official population. Checked 10 October 2026. Leipzig uses official state population, rather than its separate municipal register. © the respective statistical offices; Berlin-Brandenburg: CC BY 3.0 DE; Leipzig Open Data: DL DE BY 2.0.
What does this mean for Wittenberg?
At the end of 2025, Wittenberg had 27,033 homes and 44,937 residents: 601.6 homes per 1,000 people, compared with Berlin’s 559.2. Identify which existing homes meet today’s needs, which require conversion and where additional provision is justified.
Examine actual homes and neighbourhoods: layouts, accessibility, summer comfort and nearby services. Calculate rent, running costs and journeys for the household’s chosen home size. Test whether the improved offer finds demand and supports lasting everyday use.
Compare two actual homes ↓Historical census · 15 May 2022
Occupied space and vacancy in 2022
No newer complete municipal census is available for these measures. The 2025 stock update does not measure current vacancy. The census provides a historical baseline for a new local survey.
R = Σ(ai) / N m² per resident
aᵢ is the share of occupied residential floor area allocated to each person; N is the number of residents included. The census excludes holiday homes and collective accommodation without independent households. A higher value describes more living space per resident; quality and affordability are assessed separately.
Scroll the table sideways to see every measure.
| Rank | City | Living spacem² per resident | Vacancy rate¹% | Vacant homes²number |
|---|---|---|---|---|
| 1 | Dessau-Roßlau | 44.6 | 12.49 | 6,182 |
| 2 | Wittenberg | 44.2 | 6.66 | 1,832 |
| 3 | Halle (Saale) | 40.7 | 7.74 | 11,163 |
| 4 | Magdeburg | 40.6 | 6.66 | 9,798 |
| 5 | Leipzig | 40.2 | 4.37 | 19,308 |
| 6 | Berlin | 39.9 | 1.97 | 40,681 |
| 7 | Potsdam | 39.7 | 2.46 | 2,706 |
¹ Residential buildings excluding hostels; share of vacant homes among occupied and vacant homes. ² All buildings with residential space. The count and rate have different statistical coverage. Census figures may be slightly altered for confidentiality. These are historical residential figures, not a current survey of vacant shops.
In 2022, Wittenberg had 1,832 vacant homes. Owners reported 876 as available for occupation within three months. Their present condition, location and availability need checking locally.
Sources: Statistical Offices of Germany and the federal states. Living space per resident, table 1000A-0004 · Census definition: living space per resident (PRS028) · Building and housing census, regional table (XLSX). Resident data: DL DE BY 2.0, revision 28 June 2026. Housing table: © 2024, reproduction permitted with attribution. Retrieved 10 October 2026.
Population is the long-term context
The official projection reaches 2040; MGA’s separate extrapolation reaches 2050. Neither calculates the effect of a new use or a building conversion.
Read the long-term outlook04 · Problem and objective
Existing space needs an everyday purpose.
Population change, accessible facilities and suitable spaces need to be considered together. An unsuitable home, a missing connection or an unviable operating model can limit the use of existing buildings.
Starting point: official city figures05 · Investigation
Connect space, need and costs.
MGA guiding principle
Activate existing space. Improve daily life.
A conversion becomes meaningful when a specific need, an exceptional room and lasting use come together. Start with the people who would use it and the existing building’s strengths.
Three verifiable measures
Housing stock relative to population describes the existing supply. A local vacancy survey identifies homes to examine. Housing costs test what a household can afford. Compare each measure independently, using the same coverage and date within its series.
Read the official housing comparison ↓Assess the rooms themselves
- Character
- Record historic spaces, materials and traces; justify alterations.
- Light and sequence
- Examine sections, daylight and orientation through real rooms.
- Access
- Test routes, entrances, obstacles and independent use.
- Comfort
- Check acoustics, temperature and equipment.
- Everyday benefit
- Measure journeys and repeat use; distinguish additional benefit from relocation.
- Operation
- Agree responsibilities, opening, maintenance and recurring costs.
Which tool answers which question?
- City model: where is the opportunity?
- Locate buildings, open spaces and neighbourhood relationships. Explore Wittenberg in the 3D city model
- Network analysis: how is it connected?
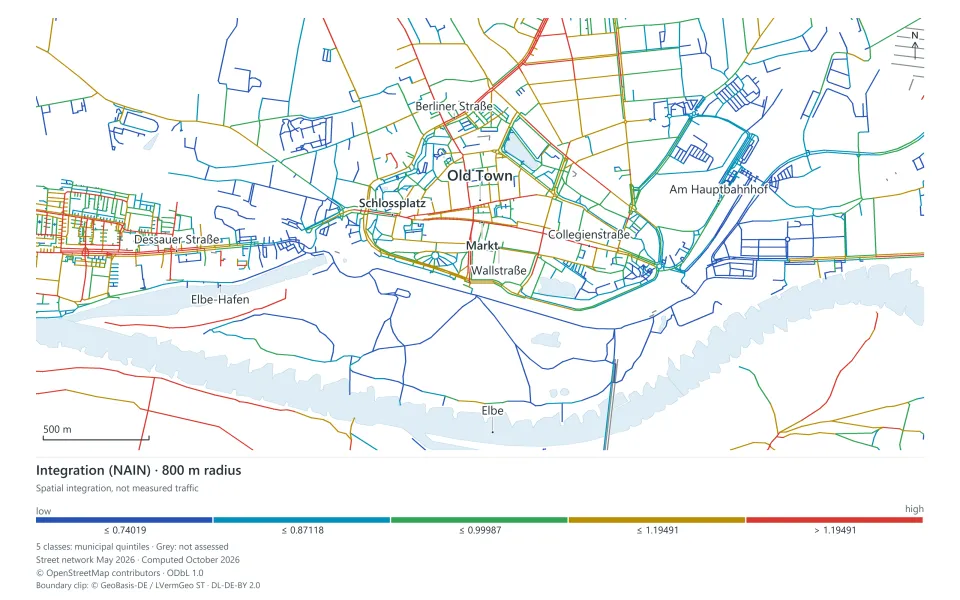
- Read actual paths. Integration describes spatial structure, not counted visitors. Explore Wittenberg’s street network
- Design comparison: what changes?
- Compare the existing network and a proposed connection with the same assumptions. Compare an additional network connection
- Housing costs: what is affordable?
- Compare differently sized homes, household costs and the building operating threshold. Calculate housing and travel costs ↓
06 · Conclusion and trial
Make city life a recurring experience.
MGA hypothesis: a useful offer in an accessible, well-designed place can support regular use. Whether it does so needs to be tested locally.
A decision to move depends on the actual home, work journeys and personal priorities. Accessible facilities and lower housing costs can be reasons to move, but do not establish additional population growth. Actual moves, departures, births and deaths require separate analysis.
Four practical starting points
| Lever | Trial | Benefit and decision |
|---|---|---|
| Work and education | Match actual recruitment and training needs with ready-to-use housing, childcare and work journeys. Piesteritz and LEUCOREA offer local points of contact. Companies at Agro-Chemie-Park Piesteritz, Research at LEUCOREA. | A workable daily life can support recruitment and staying. Check filled places, actual move-ins and retention after twelve months. New jobs must be separated from relocated jobs. |
| Housing and regional work | Compare the actual home with a Wittenberg offer, including space, travel and income changes. Trial living provides a practical check before a move. WIWOG trial living. | More suitable space or a lower total cost can help. Travel and conversion costs can absorb the gain. Use the household and building thresholds below and test the actual journey. |
| Everyday centres | Select a usable vacant space in a neighbourhood or village. Match daily services, making and cultural learning with interested users and an operator. Documented local city-lab experience, 2025. | Regular offers can shorten journeys and encourage repeat visits. Count actual opening, repeat use and cost coverage. Moving customers from another centre alone is no citywide gain. |
| Open spaces and lasting use | Connect the 2028 State Garden Show’s planned riverside landscapes with shaded daily routes, accessible recreation and a funded operating plan. State Garden Show 2028. | Everyday use after the event is the objective. Check access, use, maintenance and continued operation after six, twelve and twenty-four months. |
2017: a peak is not a lasting effect
Overnight stays fell from 270,435 in the Reformation anniversary year 2017 to 187,750 in 2019. They rose from 167,608 in 2024 to 176,463 in 2025. The series supports a peak and later recovery; it does not establish the investments’ effect on residence, employment or business turnover.
Sources: city yearbook 2019, p. 53; state tourism statistics, table 10, p. 49. Accommodation with at least ten beds or camping pitches; repeat stays possible, day visitors excluded. Wittenberg tourism figures, 2017 and 2019, Tourism statistics 2024 (PDF), Tourism statistics 2025 (PDF).
Research informing the method
Examine work, housing and services across functional areas (OECD 2025). Clarify need and operation before design and across the life cycle (Baukultur Report 2026/27). Test everyday access through real routes rather than one uniform radius (Bruno et al. 2024). These principles inform the trial; local evidence decides the intervention.
OECD: responding to demographic change · Baukultur Report: conclusions on infrastructure · A universal framework for inclusive 15-minute cities
Start now. Decide within a year.
- Months 0–3: baseline
Select a place with interested users and an operator. Record need, area, opening, journeys, use and costs. Agree a measurable target and a comparison case.
- Month 6: first effect
Check actual opening, repeat visits, accessibility and cost coverage. Correct a weak offer or access barrier promptly.
- Month 12: decision
Compare the same season and baseline. Extend, adapt or end the trial with a stated reason. Check displacement between places.
- Month 24: lasting use
Review continued use, closures, maintenance and recurring costs. Continue annually.
One architectural example
Alte Canzley
An existing MGA proposal examines how historic spaces at Schlossplatz could connect culture, work and everyday life. Test access, need and operation against the real building.
View the Alte Canzley case study