Explore buildings and open spaces, move to another place and discover how the street network connects them.
How light changes the place
Compare the geometric shadows of the available buildings and terrain. Zoom into a place for detail. Civil time includes daylight saving time. Trees, weather and thermal comfort are not represented; missing buildings and the simplified terrain can change the result.
Open the 3D view or explore the connections with Space Syntax.
Drag to move; use the mouse wheel or two fingers to zoom. Tap a place name to go there. Select Rotate to change the viewing angle. In the overview, points locate buildings; zoom in to see roofs and walls.
Explore Wittenberg’s development to 2050
Understand the place
Find the district behind the model and follow its history.
Open the district mapRead current figures
Compare the city’s population from 2020 to 2025 and its land use in 2025.
Read the dataFollow a question
Discover what connects places, stories and population change.
Discover Wittenberg© GeoBasis-DE / LVermGeo ST, DL DE BY 2.0. © OpenStreetMap contributors, ODbL.
Sources and representation
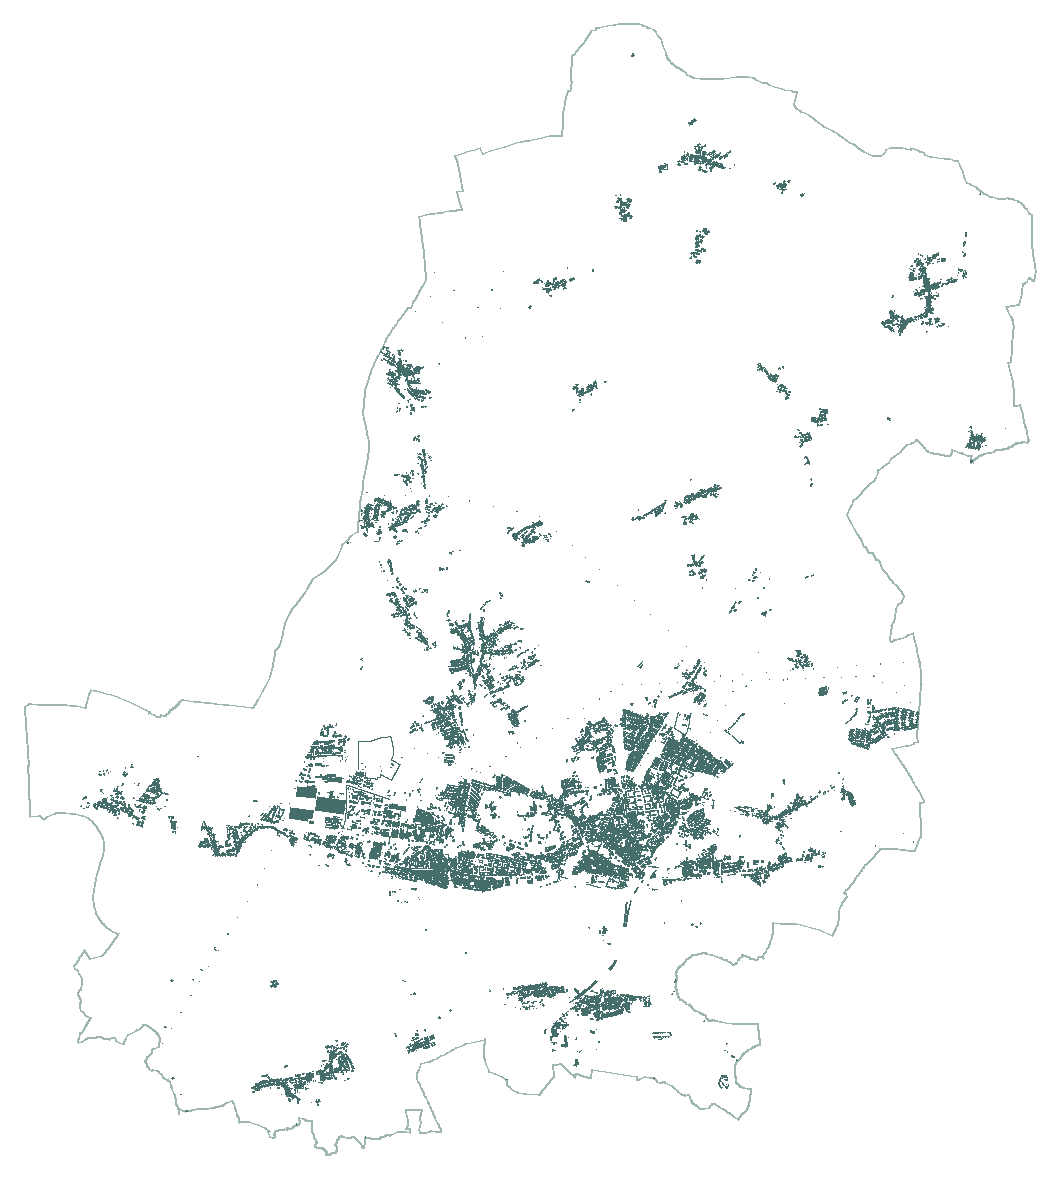
Sources: LoD2 building model (April 2026 edition) and municipal boundary. Derived by Marco Gernt Architekten: selection within the municipal boundary, triangulation of original surfaces, point overview and plan projection. No personal or parcel attributes.
Views are centred on mapped places and are not district boundary maps. The terrain uses official DGM1 data sampled at 20 metres and rendered on a 100-metre grid, without vertical exaggeration. Heights refer to DHHN2016. It provides regional context, not a survey of individual buildings or steps. Retrieved 6 October 2026; acquisition dates vary. Street snapshot: 6 May 2026; place markers: 31 May 2026. Data record.
The displayed geometry is clipped to the official municipal boundary. Sun direction follows the published NOAA/Meeus equations. Geometric position without atmospheric refraction. Shadow resolution is finite. This is an exploratory comparison, not a certified sunlight assessment.